Prediction Markets: How Retail Behaviors are Reshaping the New Financial Interface
Report
Think about the last time you watched a game, followed an election, or had a strong opinion on where crypto was heading. Now imagine being able to act on that conviction instantly, right from your wallet. That's what prediction markets are making possible – and they're growing faster than most people realize.
We partnered with
Polymarket and
Dune Analytics to look at how 1.29 million wallets actually behaved in Q1 2026. Not the headlines, not the projections – the real onchain data behind who's trading, what they're trading, and why they keep coming back.
Here are seven insights the data revealed.
1. This market is retail-led
Prediction markets in 2026 don't look like Wall Street. They look like a consumer app.
|
Tier by User Trading Volume
|
Number of Active Users
|
Share
|
Avg. Trading Volume
|
|
Whale (>$100K)
|
31,705
|
2.5%
|
$1.35M
|
|
Heavy ($10K–$100K)
|
196,463
|
15.2%
|
$27.5K
|
|
Medium ($1K–$10K)
|
392,803
|
30.4%
|
$3.6K
|
|
Light ($100–$1K)
|
351,926
|
27.2%
|
$392
|
|
Micro (<$100)
|
319,637
|
24.7%
|
$35
|
Polymarket
u
ser
n
umber and
t
rading
v
olume in Q1 2026
In Q1,
82.3% of Polymarket users
traded under $10,000 for the entire quarter. Only
2.5% crossed $100,000. The average micro user traded just
$35, and the average light user traded
$392. This is millions of people making small trades on outcomes they care about – not a handful of institutions moving large positions.
And the market is scaling fast. Monthly volume surged from roughly
$1.2 billion in 2025 to $25.7 billion by March 2026. Bernstein projects the category could hit
$240 billion in annual volume this year and reach
$1 trillion by 2030. All of that growth, right now, is being powered by retail.
2. Users don't bet bigger – they bet broader
This was one of the most interesting patterns in the data. As users get more active, they don't increase their trade sizes. They explore more categories and come back more often.
|
Tier by User Trading Volume in Q1
|
Avg. Categories Traded
|
Avg. Active Days
|
Avg. Active Weeks
|
|
Whale (>$100K)
|
3.16
|
37.0
|
7.8
|
|
Heavy ($10K–$100K)
|
3.00
|
16.8
|
5.0
|
|
Medium ($1K–$10K)
|
2.34
|
9.9
|
3.7
|
|
Light ($100–$1K)
|
1.99
|
5.7
|
3.1
|
|
Micro (<$100)
|
1.45
|
2.5
|
2.0
|
Polymarket
u
ser
a
ctivity in Q1 2026
Micro users averaged
2.5 active days and traded across
1.45 categories, while mid-tier users reached
9.9 active days and over
2.3 categories. The pattern is consistent: more engagement leads to more breadth, not bigger bets.
Each new category a user explores becomes another reason to return. This shows that retention is not driven by taking bigger risks, but by expanding the range of opportunities users can engage with.
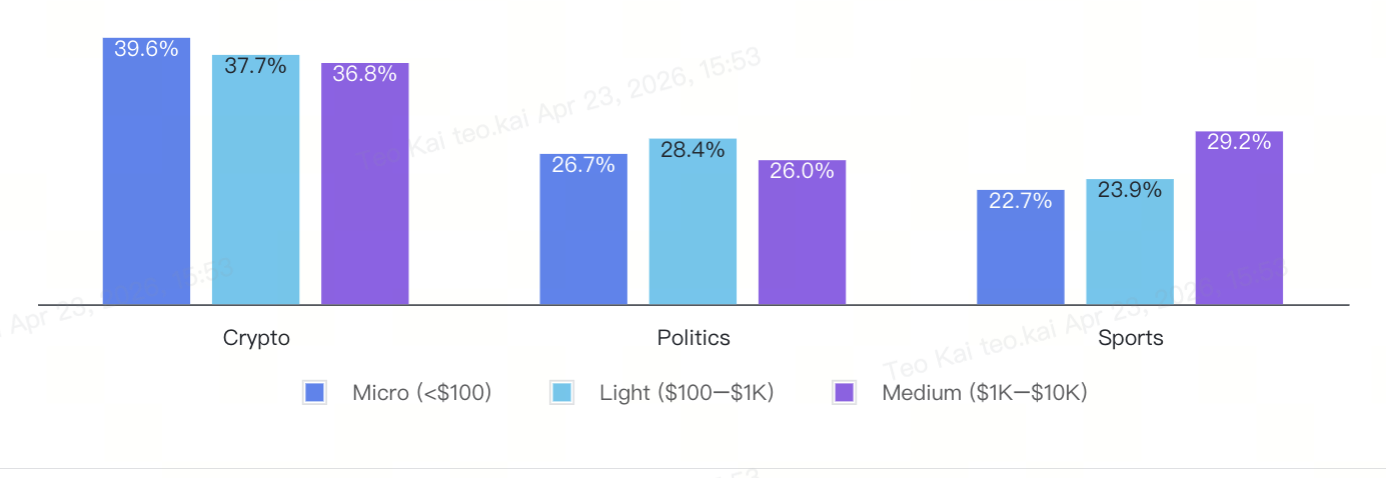
3. Crypto is the front door
Most users start with what they know. Crypto accounted for
39.6% of activity among the smallest traders in Q1. Bitcoin alone drew
593,000 users and $5.42 billion in volume, with a median trade of just
$3.16. Across Ethereum, Solana, and XRP, median bets sat around
$2 to $3. The barrier to entry is practically zero.
|
Sub-Category
|
Trading Volume (USD)
|
Number of Users
|
Median Trade (USD)
|
|
Bitcoin
|
$5.42B
|
593K
|
$3.16
|
|
Ethereum
|
$1.19B
|
294K
|
$3.11
|
|
Solana
|
$420M
|
185K
|
$2.73
|
|
XRP
|
$308M
|
132K
|
$2.67
|
|
Crypto (Other)
|
$279M
|
136K
|
$4.28
|
|
Memecoins
|
$5.6M
|
11K
|
$1.47
|
Polymarket crypto trading volume and users in Q1 2026
But here's the thing – crypto's share gradually drops as users get more active, falling to
36.8% among mid-tier traders. It's the most effective onboarding tool in the category, but it's not what keeps people around long-term.
4. Sports events are the retention engine
As users go deeper, they shift toward real-world events – and sports leads the way. Sports participation rose from
22.7% among micro users to 29.2% among mid-tier users, while politics held steady at roughly
26–28% across all segments.
Retail trade size by category (Q1 2026)
Sports generated
$10.1 billion in Q1 volume – the largest category on Polymarket. March alone
surged 45%, driven by the NBA season and NCAA March Madness. The reason is structural: frequent games, clear outcomes, and emotional stakes create a natural loop where users watch, predict, and come back for the next one.
| Sport Type | Trading Volume (USD) | Number of Users | Median Trade (USD) |
| Basketball | $4.01B | 397K | ~$6.30 |
| Football (Soccer) | $2.84B | 661K | ~$5.00 |
| Esports | $1.46B | 198K | ~$7.00 |
| Ice Hockey | $691M | 124K | $5.60 |
| Tennis | $664M | 73K | $5.71 |
| American Football | $470M | 108K | ~$6.70 |
| Combat Sports (e.g. UFC/MMA) | $128M | 40K | ~$8.30 |
| Cricket | $106M | 25K | $7.99 |
| Baseball | $104M | 31K | $5.07 |
| Motorsports (e.g. F1) | $78M | 37K | $4.21 |
| Golf | $70M | 40K | $3.71 |
Polymarket sports trading volume and users in Q1 2026
The reach is global. NBA led with
$3.11 billion across 300,000 users. NCAA Basketball added
$900 million. Football leagues, including the EPL ($540 million), Champions League ($448 million), and La Liga ($368 million) brought in significant international participation.
5. Esports is punching above its weight
Within sports, esports deserves its own spotlight. League of Legends ($657 million), CS2 ($536 million), and Dota 2 ($209 million) collectively generated roughly
$1.47 billion in Q1 – on par with some of the biggest traditional leagues.
|
Sub-Category
|
Sport Type
|
Trading Volume (USD)
|
Number of Users
|
Median Trade (USD)
|
|
NBA
|
Basketball
|
$3.11B
|
300K
|
$7.31
|
|
NCAA Basketball
|
Basketball
|
$900M
|
97K
|
$5.30
|
|
NHL
|
Ice Hockey
|
$691M
|
124K
|
$5.60
|
|
LoL
|
Esports
|
$657M
|
68K
|
$9.40
|
|
EPL
|
Football (Soccer)
|
$540M
|
117K
|
$5.60
|
|
CS2
|
Esports
|
$536M
|
72K
|
$6.12
|
|
Champions League
|
Football (Soccer)
|
$448M
|
123K
|
$6.65
|
|
NFL
|
American Football
|
$401M
|
97K
|
$5.25
|
|
La Liga
|
Football (Soccer)
|
$368M
|
97K
|
$5.48
|
|
Dota 2
|
Esports
|
$209M
|
35K
|
$6.35
|
|
Ligue 1
|
Football (Soccer)
|
$162M
|
40K
|
$5.88
|
|
UFC/MMA
|
Combat Sports
|
$110M
|
28K
|
$8.60
|
|
Cricket
|
Cricket
|
$106M
|
25K
|
$7.99
|
|
MLB
|
Baseball
|
$104M
|
31K
|
$5.07
|
|
Formula 1
|
Motorsports
|
$78M
|
37K
|
$4.21
|
Polymarket top 15 sport titles in Q1 2026
What sets esports apart is depth. Despite smaller user bases, median bet sizes run between
$6 and $9+, consistently higher than football (~$5) or basketball (~$6). That signals stronger conviction per user and makes esports one of the most naturally aligned verticals for crypto-native prediction market audiences.
6. Frequency helps with retention
Across every category, one pattern holds: the more often users can engage, the more likely they are to come back.
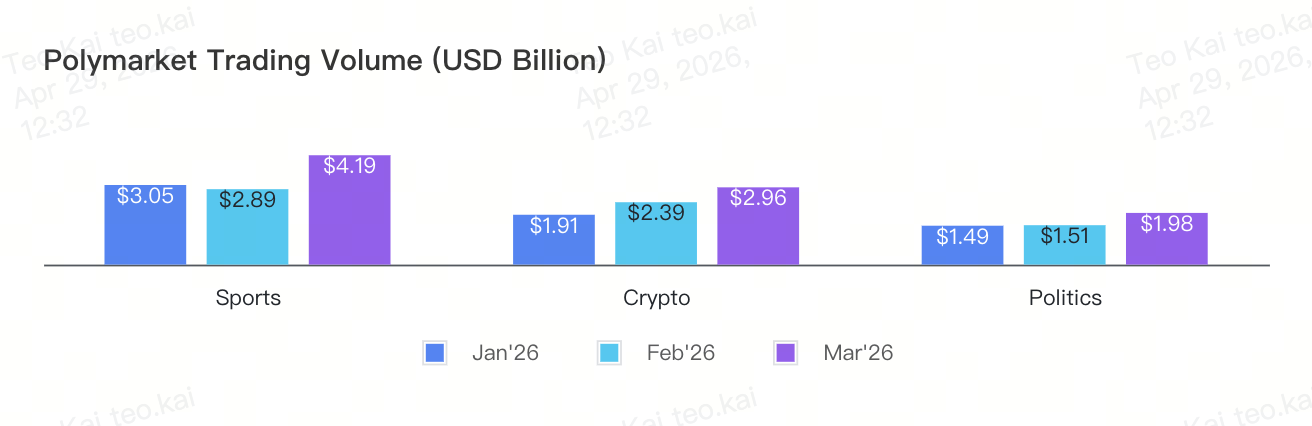
Polymarket trading volume (USD billion)
|
Category
|
Jan'26
|
Feb'26
|
Mar'26
|
Q1 Total
|
|
Sports
|
$3.05B
|
$2.89B
|
$4.19B
|
$10.1B
|
|
Crypto
|
$1.91B
|
$2.39B
|
$2.96B
|
$7.3B
|
|
Politics
|
$1.49B
|
$1.51B
|
$1.98B
|
$5.0B
|
|
Pop Culture
|
$155M
|
$95M
|
$135M
|
$385M
|
|
Finance
|
$104M
|
$116M
|
$112M
|
$332M
|
|
Weather
|
$40M
|
$59M
|
$145M
|
$244M
|
|
Science & Tech
|
$36M
|
$39M
|
$41M
|
$117M
|
Polymarket trading volume by category (Q1 2026)
Sports leads this trend, but it extends further. Weather markets surged
263% in March, driven by daily prediction loops like temperature forecasts. Crypto, as an always-on market, generated
$7.3 billion in Q1 (+55%). Politics grew to $5 billion (+33%), following steady news-driven cycles.
Prediction markets are shifting from one-off event trading to increasing adoption. Frequency drives retention and the categories with built-in recurrence are winning.
7. Prediction markets are becoming macro signal layers
Beyond trading, prediction markets are starting to serve a bigger role: real-time pricing for global uncertainty.
Political markets generated
$5 billion in Q1, with geopolitics alone accounting for
$2.41 billion across 377,000 users. Elections contributed
$942 million, but activity is no longer concentrated around singular moments. It reflects ongoing engagement with policy, trade relations, and macro developments.
|
Category
|
Jan'26
|
Feb'26
|
Mar'26
|
Q1 Total
|
|
Sports
|
$3.05B
|
$2.89B
|
$4.19B
|
$10.1B
|
|
Crypto
|
$1.91B
|
$2.39B
|
$2.96B
|
$7.3B
|
|
Politics
|
$1.49B
|
$1.51B
|
$1.98B
|
$5.0B
|
|
Pop Culture
|
$155M
|
$95M
|
$135M
|
$385M
|
|
Finance
|
$104M
|
$116M
|
$112M
|
$332M
|
|
Weather
|
$40M
|
$59M
|
$145M
|
$244M
|
|
Science & Tech
|
$36M
|
$39M
|
$41M
|
$117M
|
Polymarket crypto trading volume and users in Q1 2026
The ripple effect is showing up in how information flows. Prediction market probabilities are increasingly cited alongside polls, economic indicators, and analyst forecasts in mainstream coverage. These markets aren't just reflecting what people think but becoming part of how macro narratives take shape.
What comes next
Prediction markets are moving from occasional trades to a thriving industry. The infrastructure is maturing. Categories are expanding. The challenge now isn't building more markets – it's helping users discover, interpret, and act on them with minimal friction.
That's what we're building toward at Bitget Wallet – AI-powered insights and smart money tracking baked directly into the experience, so you can go from opinion to action in seconds. As these markets become part of how people engage with the world every day, the interface that connects you to them matters more than ever.
Read the
full report for the complete dataset by Dune Analytics and methodology.
About Bitget Wallet
Bitget Wallet is an everyday finance app designed to make crypto simple, secure, and usable in daily life. Serving over 90 million users worldwide, it offers an all-in-one self-custodial platform to send, spend,
save and
invest crypto. The app is powered by Onchain Payments Matrix, a coordination infrastructure connecting global financial rails to enable stablecoin payments at scale and programmable settlement for AI-driven transactions. Users can access
crypto cards, QR payments, bank transfers, on- and off-ramps, and an in-app marketplace to spend digital assets across online and offline merchants. Backed by a $700 million
user protection fund, Bitget Wallet supports faster, borderless onchain finance while ensuring users retain full control of their assets and private keys.
 2026-04-29
Recommended